Capacity-Based Roadmap Planning: Why Resource Allocation Matters More Than Feature Lists

Your CEO just presented the annual roadmap to the board. It’s beautiful. Forty-seven strategic initiatives, each one justified by compelling business cases, market analysis, and customer demand. The board approves enthusiastically. Everyone leaves excited about the ambitious year ahead.
You go back to your desk and do the math.
You have twelve product squads. Twenty-six two-week sprints in the year. That’s 312 squad-sprints of total capacity. Accounting for holidays, conferences, planned time off, and essential keeping-the-lights-on (KTLO) work , you’re down to about 280 squad-sprints of actual available capacity. Assuming each initiative requires an average of eight squad-sprints (discovery, delivery, polish, deployment), those forty-seven initiatives need 376 squad-sprints.
You’re short by 96 squad-sprints. That’s 36% more work than you have capacity to deliver.
The roadmap isn’t ambitious. It’s mathematically impossible.
This scenario plays out in product organizations everywhere, every quarter. Beautiful PowerPoint roadmaps filled with features, initiatives, and strategic objectives—all built on the pleasant fiction that capacity is infinite and teams can somehow deliver everything if they just work harder or more efficiently.
The problem isn’t ambition. The problem is roadmap planning that ignores the fundamental constraint determining what’s actually possible: capacity.
The PowerPoint Roadmap Problem: Unlimited Promises, Limited Capacity
PowerPoint roadmaps optimize for presentation aesthetics rather than delivery reality. They show what stakeholders want to see—lots of features, aggressive timelines, comprehensive coverage of every strategic priority. What they don’t show is the capacity required to deliver all those promises and whether that capacity actually exists.
This creates a predictable cycle that destroys trust, wastes resources, and burns out teams.
Leaders present ambitious roadmaps to boards, investors, customers, or internal stakeholders, creating expectations about what will be delivered and when. Teams spend Q1 trying to start multiple initiatives simultaneously because “everything is a priority.” By Q2, it becomes obvious that teams are stretched impossibly thin across too many objectives. Some initiatives stall. Others receive partial attention that produces half-finished work. Nothing ships at the quality or timeline originally promised.
By Q3, stakeholders start asking why the roadmap isn’t on track. Product leaders explain that teams are “working hard but hit unexpected technical complexity” or “had to reprioritize based on customer feedback”—which are often euphemisms for “we committed to more work than our capacity could support and we’re scrambling to salvage something.”
By Q4, teams have shipped maybe 60% of what was promised, much of it late and lower quality than intended. The remaining 40% gets pushed to next year’s roadmap, where it competes with new initiatives that also won’t fit within available capacity. This is why quarterly planning cadences are so important—they force regular recalibration against actual capacity.
Trust erodes on multiple fronts. Stakeholders lose confidence in roadmap commitments. Teams become cynical about planning processes that consistently over-promise. Customers who were told features would arrive in Q2 stop believing future delivery timelines.
The root cause isn’t that teams are incompetent or that leaders are dishonest. The root cause is roadmap planning tools that don’t force capacity reality into the planning process.
PowerPoint shows unlimited parallel work. You can add forty-seven initiatives to a slide deck without PowerPoint objecting that you don’t have enough squads or sprints to deliver them. There’s no constraint. No forcing function that makes you confront the math before you commit to the board.
This same problem exists in most roadmap tools that use timeline or Gantt chart views. You can stack features on a timeline until it looks impressive without any connection to the squad capacity required to actually build those features. Even popular formats like Now Next Later can fall into this trap—they’re appealing in their simplicity, but without explicit capacity constraints, “Later” becomes a dumping ground and hard decisions get avoided. The timeline gives the illusion of planning without the discipline of capacity constraints.
Why Jira Doesn’t Show Capacity Constraints
Many product teams use Jira for roadmap planning because they’re already using it for delivery tracking. But Jira’s feature-focused model creates the same capacity blindness as PowerPoint, just with more technical sophistication.
Jira lets you create epics for initiatives, break them into stories, estimate effort in story points, and assign work to sprints. This looks like capacity planning. It isn’t.
The problem is that Jira’s default model operates at the backlog level, not the capacity allocation level. You can create hundreds of tickets representing months of work without Jira ever forcing you to answer: Do you have enough squads with enough sprint capacity to actually complete all these tickets?
Jira’s sprint planning views show what’s planned for a specific sprint but don’t show the total capacity across all squads, all sprints, for the planning period. You might discover in Sprint 8 that you’ve over-allocated three squads while two other squads are under-utilized, but only if you manually check each squad’s sprint individually. There’s no system-level view that makes capacity allocation obvious across the entire roadmap timeline.
Jira also doesn’t naturally distinguish between developer capacity and non-developer capacity (designers, product managers, user researchers). You might have five “squad members” but if four are engineers and one is a designer, the squad’s capacity for engineering work is four people, not five. Jira’s story point model abstracts this away, making it hard to see when design capacity is the bottleneck even though engineering capacity is available.
Additionally, Jira’s backlog model encourages planning at the feature level (epics and stories) rather than the objective level (business outcomes). Teams fill backlogs with features without clear connections to which squad will work on which objective during which sprint. The capacity allocation question—“Squad A will work on Objective X during Sprints 5-8, consuming 3 devs and 1 designer worth of capacity”—doesn’t naturally map to Jira’s ticket-based workflows.
The result is teams discover capacity problems mid-execution rather than during planning. You realize in Sprint 12 that you’ve committed to more work than remaining capacity supports. But by then, you’ve already communicated timelines to stakeholders, customers have expectations, and sales has made commitments. Adjusting the roadmap now means breaking promises and damaging trust.
Capacity-based roadmap planning solves this by making capacity allocation the primary planning artifact rather than an afterthought.
The Squad×Sprint Grid Model: Every Cell Represents Scarce Capacity
RoadmapOne uses a fundamentally different planning model than PowerPoint timelines or Jira backlogs: the squad×sprint grid where every cell represents one squad-sprint of available capacity that can be allocated to exactly one (or split across multiple) objectives.
This grid structure creates immediate visibility into the core constraint determining what’s possible: how many squads you have, how many sprints in your planning period, and how that finite capacity gets allocated across competing objectives.
The rows represent your organizational structure—teams and squads arranged hierarchically to reflect reporting lines, tribal organization, or functional groupings. If you have three tribes each containing four squads, your grid shows those three tribes with twelve total squad rows beneath them. (For guidance on how to size those squads, see finding the optimal squad size .)
The columns represent your sprint timeline—typically twenty-six two-week sprints for an annual roadmap, or thirteen sprints for a half-year planning horizon. Each column header shows the sprint name, start date, end date, and which quarter it belongs to.
The cells where rows and columns intersect represent Work in Progress (WIP) capacity—the amount of work a specific squad can do during a specific sprint. Each WIP cell shows the capacity available: typically displayed as “3/1” meaning three developers and one non-developer (designer, product manager, etc.) available for that squad during that sprint.
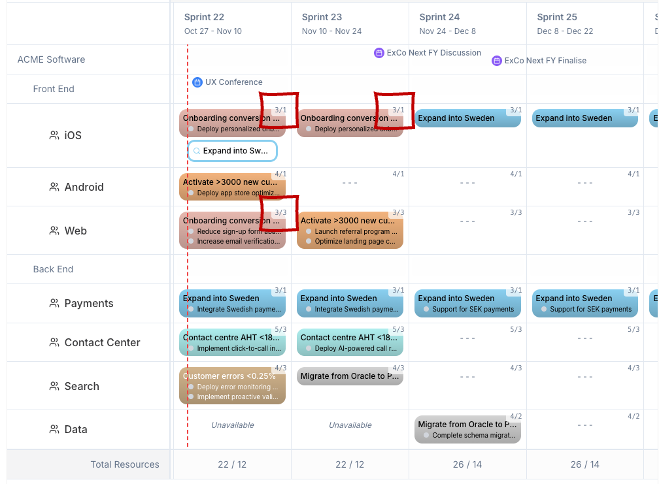 The RoadmapOne grid shows squads in rows and sprints in columns. Each cell displays available capacity (e.g., “3/1” for 3 devs, 1 non-dev), making total and allocated capacity immediately visible across the entire roadmap timeline.
This capacity number is explicit, visible, and editable. During holidays, the capacity might drop to “2/0.5” as people take time off. During conferences where the whole squad attends, capacity might be “0/0” for that sprint. During hiring ramps, capacity increases as new squad members join.
The grid makes capacity finite and visible in a way that timelines and backlogs cannot. You can immediately see total available capacity by counting the cells. You can see capacity utilization by looking at how many cells have allocations versus how many remain empty.
Most importantly, the grid forces the capacity question during planning rather than discovering it during execution. When you try to allocate more work than capacity supports, you either can’t place the allocation (the cell is already full) or you have to explicitly choose to split capacity across multiple objectives (showing everyone that neither objective gets full squad attention).
WIP Capacity Allocation: Making Planning Honest
WIP (Work in Progress) capacity represents the available resources a squad has to allocate during a specific sprint. In RoadmapOne, capacity is tracked separately for developers and non-developers because these represent different types of work constraints with different scaling characteristics.
Developer capacity typically represents software engineers, backend developers, frontend engineers, mobile developers, and other technical roles that write code, build features, and maintain systems. A squad might have three full-time developers available during a sprint, represented as “3” in the developer capacity field.
Non-developer capacity represents designers, product managers, user researchers, technical writers, and other roles that contribute to product work but don’t primarily write code. A squad might have one designer and half of a product manager’s time (who splits across multiple squads), represented as “1.5” in the non-developer capacity field.
This separation matters because different types of work consume different capacity types at different rates. Building a complex backend API might consume heavy developer capacity but light design capacity. Redesigning a complex user workflow might consume heavy design capacity while development work is modest. Tracking these separately helps teams see which type of capacity is the actual bottleneck for specific objectives.
Capacity is editable at the WIP level, meaning product managers or team leads can adjust the numbers for specific squad-sprint combinations to reflect reality. During the holiday sprint in December, Squad A might drop from “3/1” to “2/0.5” as people take vacation. During a sprint where two engineers are attending a week-long conference, capacity might drop to “2/1” reflecting reduced availability.
This granular capacity editing ensures the roadmap reflects actual available capacity rather than theoretical ideal-state capacity. When stakeholders ask “why is this taking so long?” you can show them the reduced capacity during specific sprints and demonstrate that the timeline accounts for actual availability, not wishful thinking about full-capacity all year.
Unavailable capacity can also be explicitly marked. If a squad is unavailable during a sprint (entire team at an offsite, major organizational transition, planned infrastructure migration consuming all engineering time), the WIP cell can be marked as unavailable. This grays out the cell, prevents allocations, and makes crystal clear that this squad-sprint combination isn’t available for product work.
The capacity number becomes the truth-telling mechanism that prevents over-commitment. When you try to allocate a fourth objective to a WIP cell with “3/1” capacity, you’re forced to confront: Do we split capacity across four objectives (meaning each gets 25% attention), do we increase capacity for this sprint (hire more, cancel time off, cancel the conference), or do we admit that this fourth objective doesn’t fit and must wait for a future sprint?
There’s no hiding from the math. The capacity is visible. The allocation is visible. The constraint is explicit.
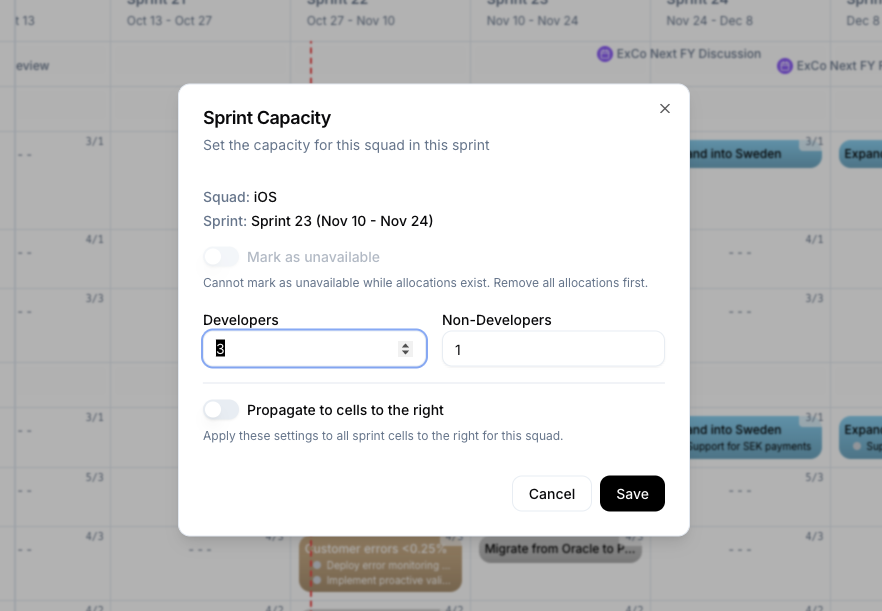 The WIP capacity modal allows editing developer and non-developer capacity for specific squad-sprint combinations, plus marking sprints as unavailable when teams can’t do product work.
The “What Fits?” Conversation with Stakeholders
Capacity-based roadmap planning transforms stakeholder conversations from aspirational feature discussions to honest trade-off negotiations anchored in mathematical reality.
Instead of: “Here are forty-seven initiatives we plan to deliver this year” (with no visibility into whether capacity supports that plan)
You have: “We have 280 squad-sprints of capacity this year. Here’s how I’ve allocated them across our top-priority objectives. Here are the initiatives that didn’t fit above the capacity line. Which of these should we swap in, and what currently allocated work should we cut to make room?”
This reframing is profoundly powerful because it shifts the conversation from “can you do more?” (which teams must always say “we’ll try” to, even when it’s impossible) to “what should we prioritize within the capacity we have?” (which forces explicit trade-off decisions).
Let’s walk through how this conversation unfolds in practice.
Step 1: Show Total Available Capacity
Open the roadmap grid view. Count the squad-sprint cells available. In this example, twelve squads times twenty-six sprints equals 312 total squad-sprint cells. Accounting for vacation, conferences, and holidays, actual available capacity is 280 squad-sprints.
Make this number explicit and visible. Write it on the whiteboard. Put it in the presentation slide. Say it out loud: “We have 280 squad-sprints of capacity this year.”
This number is finite. Observable. Contestable if someone thinks it’s wrong. But it’s not negotiable in the sense that stakeholders can’t wish capacity into existence by demanding more output.
Step 2: Show Currently Allocated Capacity
Walk through the grid showing which objectives are allocated to which squads during which sprints. Squad A is allocated to the retention objective for sprints 5-10 (six squad-sprints). Squad B is allocated to enterprise features for sprints 3-8 (six squad-sprints). And so on.
Add up the allocations. In this example, currently allocated objectives consume 240 of the 280 available squad-sprints, leaving forty squad-sprints unallocated.
This creates visual proof that the roadmap accounts for real capacity. Everything allocated on the grid actually fits within available squad-sprint cells. There’s no magic hand-waving about “we’ll figure it out” or “teams will work extra hours.” The allocations literally occupy cells on the grid. What you see is what you get.
Step 3: Show What Didn’t Fit Above the Capacity Line
Now show the list of objectives or initiatives that stakeholders want but that didn’t get allocated because capacity ran out. These might be in a “below the line” section of the roadmap, a separate “parking lot” document, or a prioritized backlog showing priority rank and capacity requirements.
“Here are twelve additional objectives that stakeholders requested. Each requires an average of eight squad-sprints. That’s ninety-six squad-sprints of demand. We have forty squad-sprints unallocated. The math doesn’t work. Sixty-six squad-sprints of demand won’t fit this year.”
This creates the forcing function for honest priority conversations.
Step 4: Force the Trade-off Decision
“Which of these below-the-line objectives is important enough to bump something currently allocated? If we want to add Objective X, which currently-allocated objective should we cut to make room?”
This is where objective prioritisation frameworks become essential—they provide a structured way to make these trade-offs using consistent criteria. This question is uncomfortable. That’s the point. Stakeholders who want “one more feature” now have to explicitly choose what gets cut to make room. They can’t have everything. They must choose.
Some stakeholders will push back: “Can’t teams just work faster? Can’t we hire more people? Can’t we push timelines?” These are legitimate questions, but they’re capacity questions with explicit trade-offs:
- Work faster: Explain the quality and sustainability costs. Fast-and-sloppy ships bugs, creates technical debt, burns out teams, and often takes longer than doing it properly once.
- Hire more: Explain the ramp time, onboarding costs, and coordination overhead. Adding people to an already-full roadmap makes delivery slower in the short term, not faster.
- Push timelines: Show exactly how much later everything moves if we add more work to the same capacity. Want to add three more objectives? Everything currently scheduled for Q4 now ships in Q1 next year.
These are all capacity conversations with visible trade-offs, not vague promises that teams will “try harder.”
Showing the Math: “48 Squad-Sprints in Q2, Here’s What Fits”
Quarterly planning conversations benefit enormously from capacity-based framing. Instead of abstract discussions about “how much can we ship in Q2,” you show the actual capacity available and what fits within it.
Q2 has thirteen two-week sprints (April-June). You have four squads available for product work. That’s fifty-two squad-sprints of theoretical capacity. Accounting for one squad attending a conference (consuming two sprints of capacity) and vacation time across the quarter, you’re down to forty-eight squad-sprints of actual available capacity.
Now show the objectives stakeholders want delivered in Q2:
- Retention improvements: eight squad-sprints (Squad A, sprints 14-17 for discovery, sprints 18-19 for delivery)
- Enterprise permissions: twelve squad-sprints (Squad B, sprints 14-19, Squad C sprints 16-19)
- Mobile app polish: six squad-sprints (Squad D, sprints 14-16)
- API rate limiting: four squad-sprints (Squad D, sprints 17-18)
- Dashboard redesign: ten squad-sprints (Squad C, sprints 14-15, Squad A sprints 20-23)
- Internationalization: eight squad-sprints (Squad B, sprints 20-23)
Total demand: forty-eight squad-sprints. Total capacity: forty-eight squad-sprints.
This is as full as the roadmap can possibly get. There is literally no room for additional work without cutting something currently allocated or extending timelines into Q3.
When a stakeholder asks “Can we also add X in Q2?” you show them the grid. “Which of these six allocated objectives should we cut or delay to Q3 to make room for X?”
This forces ruthless prioritization. Every addition requires a subtraction. Every “yes” to a new objective requires a “no” or “later” to something currently planned. The capacity constraint makes trade-offs explicit and unavoidable.
Tracking Unavailable Capacity: Holidays, Training, Conferences
Real squad capacity fluctuates throughout the year as we ramp up resources, or due to holidays, conferences, training, and other events that reduce available capacity for product work. Ignoring these reductions creates the same over-commitment problem as ignoring capacity entirely—roadmaps promise delivery that assumes full capacity all year when actual capacity is significantly lower.
RoadmapOne allows teams to explicitly mark WIP cells as unavailable or reduce capacity numbers to reflect reality.
During the December holiday sprint, most squads have reduced capacity as team members take vacation. Instead of showing “3/1” capacity (three developers, one non-developer), WIP cells show “2/0.5” or “1/0” depending on who’s actually working. This immediately shows stakeholders that December has lower delivery capacity than typical sprints, setting appropriate expectations for what can ship before year-end.
During major industry conferences, entire squads might attend, reducing capacity to zero for that sprint. Marking the WIP cell as unavailable grays it out on the grid, preventing allocations and making obvious that this squad-sprint combination isn’t available for product work.
During training periods, onboarding for new hires, or major infrastructure migrations that consume all engineering capacity, squads similarly mark capacity as reduced or unavailable.
This granular capacity tracking creates honest planning timelines. When stakeholders ask “Why will this take twelve sprints instead of eight?” you can show them that four of those sprints have reduced capacity due to holidays, conferences, and training. The feature work itself requires eight full-capacity sprints, but accounting for real availability, it spans twelve calendar sprints.
Stakeholders appreciate this honesty far more than discovering mid-quarter that delivery is “behind schedule” because the plan never accounted for the conference everyone knew about three months ago.
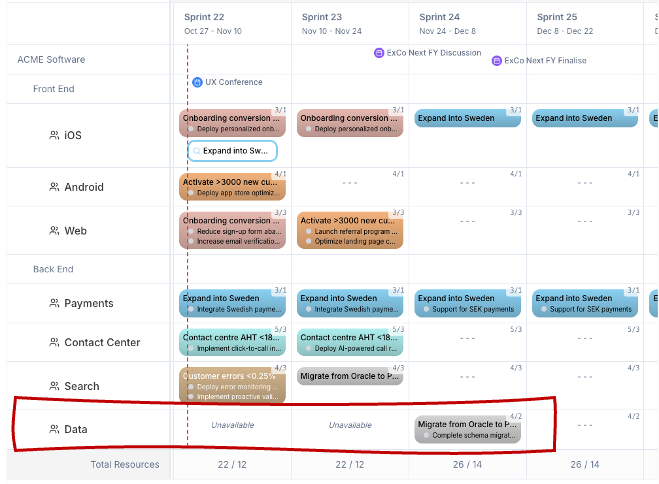 Greyed-out WIP cells show unavailable capacity during holidays, conferences, or other periods when squads can’t do product work, preventing allocations and setting realistic delivery expectations.
Multiple Objectives Per WIP: Split Capacity
Sometimes squads need to work on multiple objectives simultaneously during the same sprint. RoadmapOne supports this by allowing multiple allocations within a single WIP cell, explicitly showing that capacity is split across objectives.
This typically happens when objectives require different types of capacity (heavy design work on Objective A, heavy backend work on Objective B, allowing both to progress in parallel) or when teams are finishing one objective while starting discovery on the next.
When a WIP cell contains multiple allocations, the capacity split becomes visible. A “3/1” capacity squad working on two objectives might allocate “2/0.5” to Objective A and “1/0.5” to Objective B. This makes explicit that neither objective gets full squad attention—both are progressing, but each at partial capacity.
Split capacity allocations create important visibility for stakeholders. When a squad is split across three objectives, each objective progresses at roughly one-third the velocity of full squad focus. Delivery timelines adjust accordingly. Stakeholders see this explicitly rather than being surprised when features take three times longer than expected.
Split capacity also reveals when squads are over-allocated. If a “3/1” capacity squad has allocations totaling “4/1.5” capacity, something’s wrong. Either the capacity numbers need updating, or some allocations need to move to different sprints, or stakeholders need to understand that the squad is over-committed and delivery timelines will slip.
The grid view makes these over-allocation problems immediately obvious through visual indicators (cells highlighted in warning colors when allocated capacity exceeds available capacity), forcing teams to address the issue during planning rather than discovering it mid-sprint when it’s too late to adjust.
The Stakeholder Conversation Shift: From “Can We Add This?” to “What Should We Cut?”
The most profound impact of capacity-based roadmap planning is how it transforms stakeholder conversations from endless requests to add more features to explicit trade-off negotiations about priority within finite capacity.
Without capacity visibility, stakeholder conversations follow a predictable and frustrating pattern:
Stakeholder: “Can we add Feature X to the roadmap?”
Product Leader: “We’re pretty full, but let me talk to the teams and see what’s possible.”
Two weeks later…
Product Leader: “The teams are swamped, but they said they’ll try to fit it in.”
Three months later…
Stakeholder: “What happened to Feature X? I thought we were doing it this quarter?”
Product Leader: “The teams are working on it, but it got delayed because of other priorities.”
This pattern destroys trust. Stakeholders feel like they’re getting vague non-answers. Product leaders feel like they’re constantly managing impossible expectations. Teams feel pressured to over-commit then blamed when they can’t deliver everything.
Capacity-based roadmap planning changes this conversation entirely:
Stakeholder: “Can we add Feature X to the roadmap?”
Product Leader: [Opens roadmap grid] “Let’s look at Q2 capacity. We have forty-eight squad-sprints available. We’ve allocated forty-five to these six objectives. That leaves three squad-sprints unallocated. Feature X requires eight squad-sprints. It doesn’t fit without cutting something. Which of these six objectives should we delay to Q3 to make room for Feature X?”
Stakeholder: [Looks at the six allocated objectives] “Hmm. Actually, all six are more important than Feature X. Can we do Feature X in Q3 instead?”
Product Leader: “Absolutely. Let’s look at Q3 capacity and see where it fits.”
This conversation is radically different in several ways.
First, it’s grounded in mathematical reality rather than vague assessments of team capacity. The numbers are visible. The constraint is explicit. There’s no ambiguity about whether capacity exists or not—you can literally see it on the grid.
Second, it forces the stakeholder to make the priority decision rather than asking teams to magically create capacity. The product leader isn’t saying “no”—they’re showing the constraint and asking “given this constraint, what’s most important?” That’s a very different conversation.
Third, it creates immediate resolution rather than prolonged ambiguity. Instead of “let me talk to teams and get back to you,” the answer is visible in real-time during the conversation. Either Feature X fits within available capacity, or it doesn’t. Either something else gets cut to make room, or Feature X waits for future capacity.
Fourth, it builds trust through transparency. Stakeholders can see exactly why Feature X doesn’t fit and what would need to change to make it fit. They’re not taking the product leader’s word that teams are “too busy.” They’re seeing the capacity allocation with their own eyes.
This conversation pattern scales across all stakeholder interactions: leadership asking for new strategic initiatives, sales requesting customer-specific features, customer success escalating critical fixes, engineering advocating for technical debt reduction. Every request gets evaluated against the same visible capacity constraint, forcing the same explicit trade-off conversation.
Why This Matters More Than Velocity Optimization
Many product organizations obsess over team velocity—measuring story points per sprint, tracking whether teams are “getting faster,” creating pressure to increase throughput.
This focus on velocity misses the forest for the trees. Velocity optimization helps you deliver work slightly faster, but capacity-based planning determines whether you’re working on the right things in the first place.
A team delivering the wrong features 20% faster is still delivering the wrong features. A team working at sustainable pace on well-prioritized objectives that fit within capacity will deliver more business value than a team scrambling across over-committed roadmaps at unsustainable sprint velocities.
Capacity-based planning also prevents the most insidious form of velocity pressure: over-commitment that leads to quality shortcuts, technical debt accumulation, and eventual velocity collapse.
When roadmaps ignore capacity and commit to more work than teams can deliver, the initial response is often “work harder” or “cut corners to go faster.” Teams skip discovery. They ship minimum-viable implementations without polish. They accumulate technical debt by implementing quick hacks instead of proper solutions.
This creates short-term velocity increases that stakeholders celebrate (“Look, the team shipped three features this sprint instead of two!”) followed by medium-term velocity collapse as technical debt compounds, quality issues create production incidents that consume engineering capacity, and the codebase becomes harder to work with.
Eventually, teams spend more time fighting technical debt and fixing quality issues than building new features. Velocity drops below where it started. But now the codebase is worse, team morale is lower, and stakeholder trust is damaged because promises were made and repeatedly broken.
Capacity-based planning prevents this cycle by forcing honest roadmaps from the start. When capacity is visible and allocations are explicit, stakeholders see realistic timelines based on sustainable team capacity. There’s no pressure to over-commit because the math is transparent. Teams can plan proper discovery, allocate time for quality, and maintain technical health—all of which sustain long-term velocity rather than sacrificing it for short-term speed.
Real-World Capacity Planning Examples
Let’s explore how different types of organizations use capacity-based roadmap planning to improve delivery predictability and stakeholder trust.
SaaS Company: Annual Planning with Seasonal Capacity Variations
A mid-stage SaaS company plans annual roadmaps using RoadmapOne’s capacity-based grid. They have eight product squads and plan in two-week sprints, giving them twenty-six sprints (fifty-two weeks) per year times eight squads = 208 theoretical squad-sprint cells.
However, actual capacity is lower due to seasonal variations. During December, capacity drops by 30% as team members take holiday vacation. During their annual company offsite in January (one week), capacity drops to zero for all squads. During summer months (July-August), capacity drops by 15% as people take summer vacations. During their major industry conference in September (one week), two squads attend, reducing those squads’ capacity to zero for that sprint.
After accounting for these reductions, actual available capacity is 168 squad-sprints, not 208. That’s a 19% reduction from theoretical maximum—a massive difference when planning annual commitments.
The company uses this realistic capacity number for all roadmap planning. When stakeholders propose new initiatives, product leadership opens the grid and shows: “We have 168 squad-sprints this year. We’ve allocated 155 to our top-priority objectives. That leaves thirteen unallocated. Your proposed initiative requires twenty squad-sprints. It doesn’t fit this year. Should we prioritize it for next year, or is there something currently allocated that we should cut to make room?”
This capacity-based framing has transformed their annual planning process from aspirational feature lists that consistently under-deliver to realistic roadmaps that teams actually execute, building stakeholder trust year over year.
Enterprise Software: Balancing Product Work with Customer-Specific Commitments
An enterprise software company faces a common challenge: balancing capacity between product roadmap work that benefits all customers and customer-specific features required by large contracts.
They use RoadmapOne to explicitly allocate capacity between these competing demands. Each quarter, they allocate 60% of squad capacity to product roadmap objectives and reserve 40% of capacity for customer-specific work that emerges from sales commitments.
This 60/40 split is visible on the grid. Product roadmap objectives occupy sixty squad-sprints. Customer-specific work is pre-allocated as “Customer Requests” blocks occupying forty squad-sprints. As specific customer requests come in, they replace these generic blocks with actual customer feature allocations.
When sales asks “Can we commit Feature X to Customer Y by end of quarter?” product leadership looks at the customer-request capacity blocks. If capacity exists within the pre-allocated forty squad-sprints, the answer is “Yes, we can commit, and here’s which squad will do it during which sprints.” If the customer-request capacity is already full, the answer is “No, we’re at capacity for customer requests this quarter. Can this wait until next quarter, or is there a product roadmap feature we should cut to make room?”
This explicit capacity split prevents the classic enterprise software problem where customer-specific work gradually consumes 100% of capacity, leaving no room for product evolution that benefits all customers.
Startup: Demonstrating Capacity Reality to Investors
An early-stage startup uses capacity-based roadmap planning to manage investor expectations during fundraising.
Investors often ask “Why aren’t you shipping faster? You have eight engineers. Shouldn’t you be launching more features?”
The founding team opens RoadmapOne and walks through the capacity reality. “We have four product squads, each with two engineers. Theoretical capacity is four squads times twenty-six sprints = 104 squad-sprints per year. But actual capacity accounts for hiring ramp time (new engineers take four weeks to become productive), technical debt paydown (we allocate 20% of capacity to platform health), and discovery work (we allocate two sprints per objective for validation before building). After accounting for these, we have sixty squad-sprints available for delivery work this year.”
They then show allocations: “We’ve allocated those sixty squad-sprints across eight strategic objectives. Here’s the capacity math for each objective showing discovery sprints, delivery sprints, and polish sprints. This is genuinely as fast as we can ship high-quality, validated features with current capacity.”
This capacity-based explanation helps investors understand that “ship faster” requires either hiring more engineers (which the startup is doing with the current fundraise), cutting quality corners (which creates technical debt the startup explicitly avoids), or reducing the number of objectives (which means cutting features from the roadmap).
Investors appreciate this transparency far more than vague promises to “work harder” or “optimize processes.”
Common Mistakes in Capacity-Based Planning
Even teams committed to capacity-based roadmap planning often make predictable mistakes that undermine the benefits.
Mistake 1: Setting Capacity to Ideal State Rather Than Reality
Teams mark every WIP cell with ideal-state capacity (three developers, one designer) without accounting for reduced capacity during holidays, conferences, or ramp time for new hires. This creates the same over-commitment problem as ignoring capacity entirely—the roadmap shows allocations that look achievable based on ideal capacity but are actually impossible with real capacity.
The solution is ruthlessly honest capacity tracking. Every WIP cell should reflect actual available capacity for that specific squad during that specific sprint, accounting for all known reductions (vacation, conferences, training, ramp time).
Mistake 2: Not Updating Capacity When Reality Changes
Team composition changes throughout the year. Engineers join or leave. Designers get promoted or transferred. Squads get reorganized. Teams mark capacity once during annual planning then never update it as reality evolves.
This creates increasing divergence between roadmap capacity and actual capacity, eventually making the roadmap misleading rather than useful.
The solution is treating capacity as a living number that gets updated whenever team composition changes. When a new engineer joins Squad A in Sprint 10, capacity increases from “3/1” to “4/1” starting that sprint. When a designer moves to a different team in Sprint 15, capacity drops accordingly.
Mistake 3: Ignoring Non-Developer Capacity Constraints
Teams track developer capacity but ignore designer, product manager, and user researcher capacity, assuming these roles can magically scale to support whatever engineering capacity exists.
This creates bottlenecks where engineering capacity is available but design capacity is the constraint. Features wait for design work that could have been anticipated if non-developer capacity was tracked explicitly.
The solution is tracking both developer and non-developer capacity separately, making visible when design capacity (or PM capacity, or research capacity) is the actual constraint limiting delivery.
Mistake 4: Splitting Capacity Too Much
Teams split squad capacity across four or five objectives simultaneously, believing this maximizes utilization. In reality, it maximizes context switching and minimizes deep work, making everything take longer than if squads maintained focus on fewer objectives.
The solution is limiting work in progress to one or two objectives per squad per sprint. If more objectives need attention, allocate them to different sprints where squads can give them focused capacity rather than diluted attention split five ways.
Conclusion: Capacity Is the Constraint That Determines What’s Possible
Product roadmaps that ignore capacity create beautiful lies—ambitious plans that look impressive in presentations but collapse on contact with delivery reality.
PowerPoint lets you promise forty-seven initiatives without confronting whether you have capacity to deliver them. Jira lets you fill backlogs with hundreds of tickets without showing whether squads have sprint capacity to complete them. Timeline views let you stack features on Gantt charts without connecting them to the squad capacity required to build them.
Capacity-based roadmap planning forces honesty from the start. The squad×sprint grid makes total capacity visible (twelve squads times twenty-six sprints equals 312 cells). WIP capacity numbers make available capacity explicit (accounting for holidays, conferences, and reduced periods). Allocations visibly consume capacity, making obvious when you’re approaching limits or trying to allocate more work than capacity supports.
This honesty transforms stakeholder conversations from endless feature requests to explicit trade-off negotiations. When stakeholders can see the capacity constraint, they understand that adding one more feature requires cutting something currently allocated or extending timelines into future quarters.
Teams deliver what they commit to because commitments are based on realistic capacity rather than aspirational hopes. Stakeholder trust builds as roadmaps consistently deliver promised outcomes rather than consistently under-delivering against impossible plans.
That’s not just better roadmap tracking. That’s honest planning anchored in the mathematical reality of finite capacity—the fundamental constraint that determines what’s actually possible.
References and Further Reading
- Grid vs. Timeline: Why Grids Reveal Capacity Truth - Deep dive into why grid-based planning beats timeline views
- Master Roadmaps vs. Scenario Planning - Using capacity-based scenarios to explore what-if alternatives
- Time-Boxed Discovery - Allocating discovery capacity explicitly rather than letting it consume delivery capacity invisibly
- Objective Prioritisation Frameworks - Prioritizing which objectives fit above the capacity line
- Marty Cagan, EMPOWERED: Ordinary People, Extraordinary Products - Building roadmaps around team capacity and sustainable delivery