Objective Tagging: Pirate Metrics (AARRR)
Charting the Customer Voyage from First Click to Profit

This is one of RoadmapOne ’s articles on Objective Tagging methodologies .
Dave McClure uttered “AARRR” at a 2007 SeedCamp workshop and product managers have been talking like pirates ever since. More than a catchy acronym, the five-stage funnel—Acquisition, Activation, Retention, Referral, Revenue—offered the first end-to-end, metric-centred view of how a product creates compounding value.
Tagging your roadmap items with AARRR lets Product teams pinpoint which leaky bulkhead sinks growth; frames board conversations around numbers not vibes; and slices investment by lifecycle stage with a single glance in RoadmapOne.
I’ve had a soft-spot for Pirate Metrics; ever since the amazing Dave Slocombe introduced me to them back in 2015. They’re a super helpful thinking tool and a great way to ensure a balanced portfolio of initiatives.
In particular, Activation is a CRUCIAL step that often disappears in the gap between marketing and product, and is often the biggest driver of growth.
1. From 500 Startups to Boardrooms
McClure’s original goal was brutally practical: help early-stage founders show traction to investors without burying them in vanity metrics. The genius was its universality—e-commerce, marketplaces, DevTools, even regulated fintech can map work to the same five questions:
| Stage | Key question |
|---|---|
| Acquisition | How do users find us? |
| Activation | Did they reach a first “Aha!”? |
| Retention | Will they come back? |
| Referral | Will they spread the word? |
| Revenue | When do we get paid? |
Boards love it because each stage pairs naturally with a single north-star metric—CPC, Time-to-Value, Logo Churn, Viral Coefficient, LTV-CAC. For teams wanting a complementary view of portfolio balance, see also the Run-Grow-Transform framework.
2. Deep Dive into Each Stage
2.1 Acquisition: Winning Qualified Attention
Acquisition spend usually dwarfs the rest, but mis-tagging hides it. By labelling every roadmap item that touches lead flow—SEO schema fixes, LinkedIn ad integrations, co-marketing landing pages—as A-Acquisition, a PM can contrast cost per signup with engineering hours. If CPC drops while dev spend spikes, the board understands why. In RoadmapOne, filtering by Acquisition instantly shows your top-of-funnel investment as a percentage of total capacity.
Key Metric: Customer Acquisition Cost (CAC)
$$ \text{CAC} = \frac{\text{Total Marketing + Sales Spend}}{\text{New Customers}} $$ For SaaS, healthy CAC ranges from £50-500 depending on your ACV—but the real question is whether your roadmap investment is driving that number down.
2.2. Activation: Speeding Users to “Aha!”
The most common SaaS pitfall is celebrating signups while 60% never realise value. Activation work includes guided tours, default templates, empty-state illustrations, and API quick-starts. Tagging clarifies how retention forecasts depend on activation velocity, making slow onboarding a portfolio-level problem rather than UX’s side quest.
Key Metric: Activation Rate
$$ \text{Activation Rate} = \left( \frac{\text{Users reaching “Aha” moment}}{\text{Total Signups}} \right) \times 100 $$ The trick is defining what “Aha” means for your product. Some famous examples:
- Facebook: Users who added 7 friends in 10 days had dramatically higher retention—that became their activation metric
- Slack: Teams exchanging 2,000 messages almost never churned
- Twitter: Users who follow 30 accounts see enough value to stick around
- Uber: Completing your first ride—suddenly hailing cabs feels medieval
- Dropbox: Uploading your first file to a synced folder
- Zoom: Hosting your first meeting without technical drama
- Loom: Sharing a video and having someone actually watch it
What’s your magic number?
One of our customers is in the gaming space. Customers who don’t fund their wallet within 24 hours of sign-up will almost never return.
2.3. Retention: Fighting the Rust of Indifference
Support tooling, performance hardening, and behavioural emails all serve Retention. Yet because they feel “maintenance-y”, they’re often dumped under Run/BAU and down-prioritised. AARRR tagging reframes them as revenue compounding: a 2-point churn drop on a £50m ARR base equals £1m in new ACV without a single sales call. Tagging retention work separately stops it hiding in BAU—RoadmapOne’s analytics reveal whether you’re under-investing in keeping existing customers.
Key Metric: Monthly Churn Rate and DAU/MAU
$$ \text{Monthly Churn Rate} = \frac{\text{Customers Lost}}{\text{Customers at Start of Period}} \times 100 $$ For engagement stickiness, track your DAU/MAU ratio—anything above 20% is solid for most SaaS, while consumer apps like Facebook aim for 50%+.
2.4. Referral: Bottling Delight
Virality rarely appears spontaneously—engineers must expose sharable artefacts, product-led prompts, or partner webhooks. By tagging these items clearly, PMs surface the trade-off between brand reach and core feature velocity. Boards grasp how a “Share workspace” button, though tiny, can shift the funnel’s entire cost base.
Key Metric: Viral Coefficient
$$ \text{Viral Coefficient (K)} = \text{Invites per User} \times \text{Conversion Rate} $$ If K > 1, you get exponential growth. Dropbox achieved 60% of all signups through referrals with their famous two-sided incentive: give 500MB, get 500MB. That single mechanic transformed their CAC overnight.
2.5. Revenue: Extracting Value, Not Just Visitors
Pricing-plan paywalls, metering logic, Stripe tax localisation—every line of code that turns usage into cash belongs here. When the CFO challenges freemium expansion, filter RoadmapOne by Revenue to show exactly how much capacity is allocated to monetisation versus vanity metric pursuits.
Key Metric: LTV:CAC Ratio > 3:1
Your Customer Lifetime Value (LTV / CLV) should be at least three times Customer Acquisition Cost (CAC).
For SaaS, also track Expansion MRR: revenue growth from existing customers via upsells and add-ons. The best companies grow faster from expansion than new logos.
3. Anti-Patterns to Avoid
3.1 Stage Soup
The problem: Tagging a single epic with every AARRR stage (“this touches acquisition AND activation AND retention!”) defeats the entire purpose of prioritisation.
Why it happens: Teams are afraid to commit, or genuinely believe everything is interconnected.
The fix: Ask: “Which funnel stage will move FIRST if this ships?” Tag that one stage only. In RoadmapOne, the analytics chart will show a clean distribution instead of meaningless “multi-stage” items that hide real allocation.
3.2 Referral Blind Spots
The problem: “We have no Referral work because virality isn’t critical to our business.”
Why it’s dangerous: If your NPS is 60+ but you have zero Referral-tagged items, you’re leaving compounding growth on the table. The absence of tags is a risk signal, not a strategy.
The fix: Even B2B products benefit from referral mechanics (testimonials, case study programs, partner integrations). Tag this work explicitly so leadership can see the gap.
3.3 Retention Buried in BAU
The problem: Performance fixes, support tooling, and stability work get tagged as “maintenance” or dumped into Run/BAU , making retention investment invisible.
Why it matters: A 2-point churn reduction on a £50m ARR base equals £1m in new ACV without a single sales call. That’s not maintenance—that’s strategic investment.
The fix: If work reduces churn or increases engagement frequency, tag it as Retention. RoadmapOne’s analytics will reveal whether you’re under-investing in keeping existing customers.
3.4 Activation Theater
I see this constantly with our clients. It’s doubly insidious because Marketing teams love to talk about their Cost-of-Acquisition, but completely ignore whether the (very expensive) customers are actually signing-up or using the product.
The gaming company I mentioned earlier used to see exactly this behaviour. A customer is only activated when they put money into their wallet. Until that point, it’s all wasted spend.
The problem: Celebrating signup numbers while ignoring that 60% of users never reach the “Aha!” moment.
Why it happens: Acquisition is visible, exciting and Google makes it easy-to-measure; activation requires instrumentation, deep analytics, and patience.
The fix: Define your activation event (first value moment), measure it, and tag work that accelerates time-to-value. If your AARRR chart shows heavy Acquisition and light Activation, you’re filling a leaky bucket.
4. Pirate Metrics in RoadmapOne
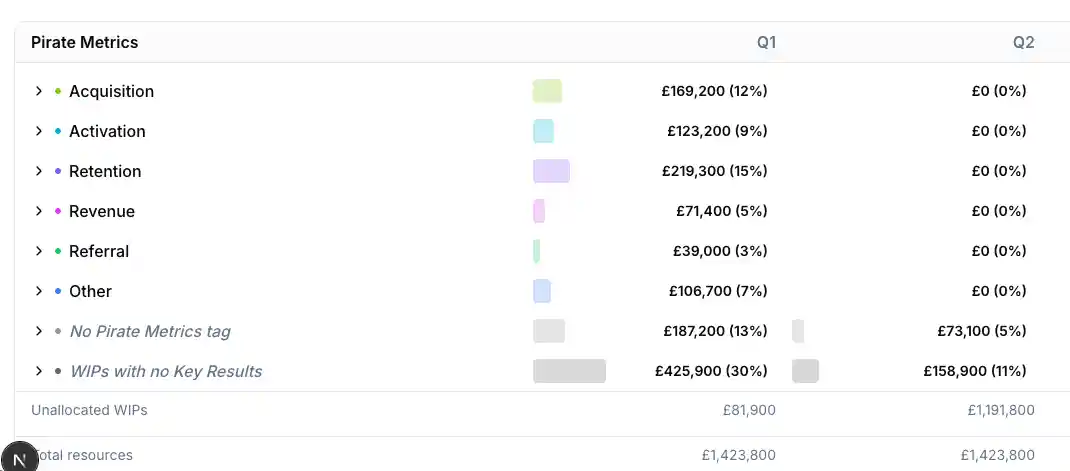
You can go from “no roadmap” to “AARRR-tagged portfolio view” in about 20 minutes. RoadmapOne supports Pirate Metrics out-of-the-box, making it simple to see whether your investment is balanced across the funnel—or whether you’re over-allocating to Acquisition while starving Retention.
The real value isn’t the tagging itself; it’s the conversation it unlocks. When leadership can see “60% Acquisition, 25% Retention, 0% Referral” at a glance, the discussion shifts from “we need more features” to “we need to plug the referral gap.”
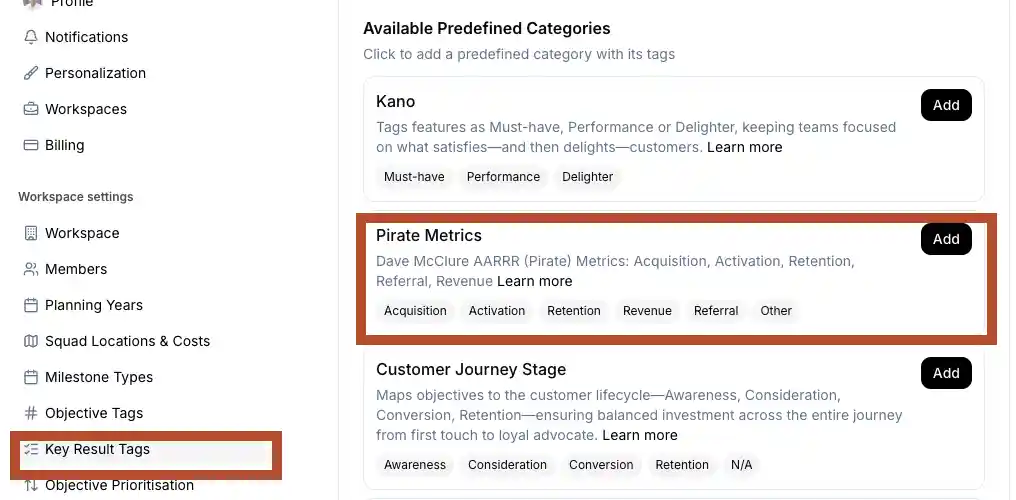
To use Pirate Metrics in RoadmapOne, first navigate to Key Result Tagging in your preferences, and click “Add” to enable Pirate Metrics tagging.
Now when you open the Objective panel, you can tag each Key Result with the relevant Pirate Metric.
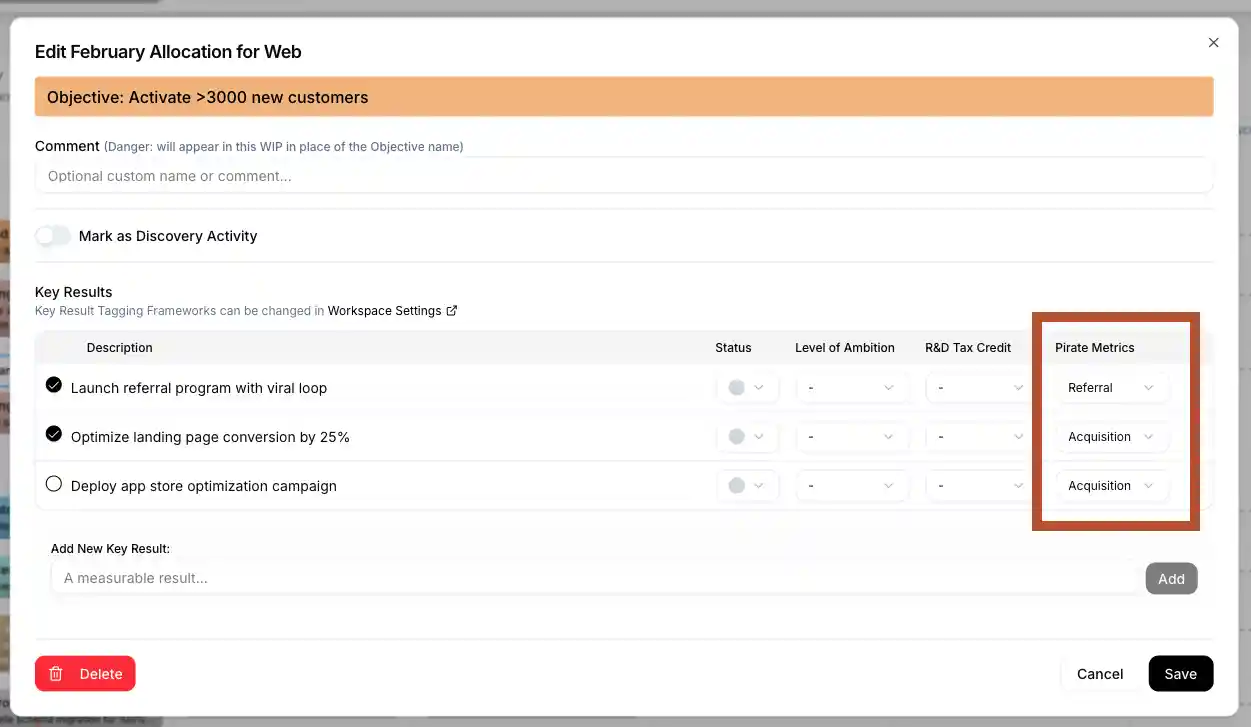
In the above example we can see that the “Activating 3000 new customers” objective has 3 potential Key Results: two at the Acquisition stage and one at the Referral stage. Now navigate to the Analytics tab and we can instantly see how our roadmap breaks down by Pirate Metrics stage.
5. Frequently Asked Questions
What’s the difference between AARRR and RARRA?
AARRR follows the traditional funnel: Acquisition → Activation → Retention → Referral → Revenue. RARRA flips the priority order to Retention → Activation → Revenue → Referral → Acquisition. The logic? For mature products, retaining existing users is cheaper and more valuable than acquiring new ones. If your retention is leaky, pouring more into acquisition just accelerates the churn. Fix the bucket before filling it.
Should I track all five AARRR metrics at once?
No. Focus on your leakiest stage first. If you’re losing 60% of signups before activation, optimising referral mechanics is premature. Use RoadmapOne’s analytics to identify where the biggest drop-off occurs, then concentrate roadmap investment there until you’ve plugged the gap.
How do I find my product’s activation metric?
Look for the behaviour that correlates most strongly with long-term retention. Run a cohort analysis: compare users who churned within 30 days against those who stayed 6+ months. What did the retained cohort do that churners didn’t? That action—whether it’s “added 7 friends” or “sent 2,000 messages”—is your activation event.
Is AARRR only for startups?
Not at all. While Dave McClure designed it for early-stage companies pitching investors, the framework scales beautifully. Enterprise SaaS companies use it to balance portfolio investment. As I mentioned earlier, we used it at Trainline (a £4bn revenue eCommerce business). The difference is volume: a startup might have one initiative per stage, while an enterprise might have dozens. The tagging and analytics approach works identically.
How often should I review my AARRR distribution?
Quarterly is typical, aligned with roadmap planning cycles. In RoadmapOne, pull up the Pirate Metrics analytics view before each planning session. If you’ve spent three quarters heavy on Acquisition with no Retention investment, the data makes the rebalancing conversation unavoidable.
6. Pirate Metrics Key Takeaways
- AARRR tagging turns an abstract funnel into a living investment ledger.
- Boards and growth teams see the same slice of effort, killing funnel blame games.
- In RoadmapOne, tag-driven charts replace spreadsheet archaeology, letting pirates steer by clean stars, not cloudy tea leaves.

For more on Objective Tagging methodologies, see our comprehensive guide . If you’re looking for prioritisation frameworks to decide which AARRR stage to invest in first, explore our Objective Prioritisation methods. And for teams implementing OKRs, see how OKRs for Product Teams connects objectives to measurable key results.