Key Result Tagging: Confidence Level %
From Static Predictions to Dynamic Risk Signals
This is one of RoadmapOne ’s articles on Key Result Tagging methodologies .
The moment you write an OKR, you make a prediction: “I believe we can achieve this.” But belief isn’t binary—it exists on a spectrum from wild hope to near certainty. The problem with traditional OKRs is they treat all predictions equally, hiding the difference between “we’re 90% confident” and “we’re throwing spaghetti at the wall.” Confidence Level % tagging solves this: score each key result’s achievability from 0-100%, update it as evidence arrives, and suddenly you have an early warning system that screams “intervene now” before quarterly reviews confirm the damage.
When you tag confidence levels in RoadmapOne and update them weekly, dashboards become risk radar. A CPO filtering by “0-25% Confidence” sees which results are dying early—while there’s still time to pivot or kill them. A board tracking confidence trends spots teams whose optimism evaporates mid-quarter, signalling resourcing gaps or strategic missteps. Tag it, track it, act on it.
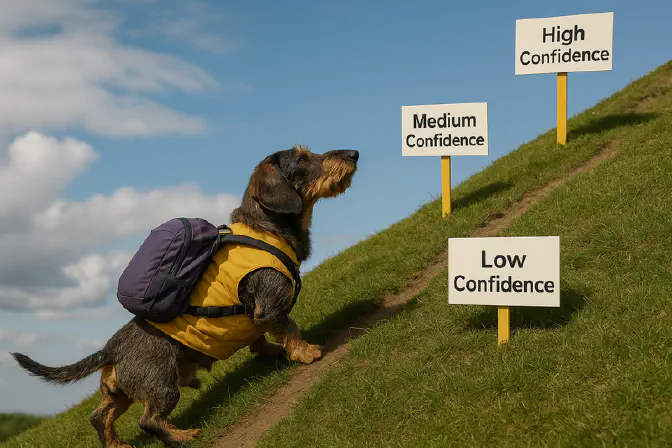
The Four Confidence Bands
Confidence isn’t one number—it’s a spectrum revealing different states of execution maturity. Tag confidence in quartiles and patterns emerge that single scores miss.
0-25% Confidence: The Long Shots
Results at 0-25% confidence are exploratory—you’re testing hypotheses with weak signals of success. Maybe early experiments flopped, technical unknowns emerged, or market response underwhelms. This isn’t failure; it’s discovery that the path forward is murkier than expected.
Tag 0-25% when evidence suggests significant obstacles without clear solutions. “Launch in Japan hitting 10k DAU in month one” sits here if week three shows 200 DAU and no growth levers working. “Reduce infrastructure costs 50% via novel architecture” lands here if your proof-of-concept crashed under load.
Low confidence isn’t shameful—it’s valuable information. When RoadmapOne shows a result trending into 0-25%, leadership should ask: “Is this worth saving, or should we reallocate?” That’s a strategic question, not a blame game. The early signal enables intelligent pivot or kill decisions before you’ve burned the quarter.
25-50% Confidence: The Uncertain Middle
Results at 25-50% confidence have plausible paths forward but significant risks remain. You’ve got some positive signals—early experiments show promise, technical approaches look viable, user interest exists—but execution is far from guaranteed. This is the land of “we think we can, but it’ll be hard.”
Tag 25-50% when the result feels achievable with focus and some luck. “Increase conversion 20% through checkout experiments” sits here if tests show 8% lift with room for iteration. “Achieve 99.9% uptime via infrastructure redesign” lands here if the architecture is sound but rollout risk is real.
Mid-confidence results demand attention, not panic. When RoadmapOne highlights 25-50% confidence results, leadership should ask: “What resources or decisions would shift this to 50-75%?” Often it’s focus, staffing, or removing blockers—fixable problems if surfaced early.
50-75% Confidence: The Likely Wins
Results at 50-75% confidence are on track—execution risks exist but you have line of sight to success. Early results validate the approach, team capability is proven, and blockers are manageable. This is the confidence band most teams target for stretch goals.
Tag 50-75% when evidence supports cautious optimism. “Grow ARR £2m via enterprise sales motion” sits here if you’re at £1.3m by mid-quarter with pipeline strong. “Reduce p95 latency to sub-200ms” lands here if you’re at 280ms with proven optimisation techniques queued.
High-confidence results still need stewardship. When RoadmapOne shows results trending 50-75%, leadership should ask: “What could derail this?” The answer identifies risks worth mitigating—external dependencies, capacity crunches, scope creep—while there’s time to act.
75-100% Confidence: The Near Certainties
Results at 75-100% confidence are virtually assured barring black swan events. You’ve either already achieved most of the target or the remaining path is trivial. This confidence level should characterise committed goals and safe operational improvements.
Tag 75-100% when success is nearly guaranteed. “Migrate 100% of users to new authentication system” sits here if you’re at 92% with two weeks left and the process is smooth. “Achieve SOC 2 certification” lands here if the auditor has pre-approved all controls and the formal review is a formality.
Very high confidence on stretch goals is a red flag—it means you’re not stretching. When RoadmapOne shows 80% of key results at 75-100% confidence, the roadmap is sandbagged. Present this to leadership and ask: “Are we ambitious enough?” The data forces the conversation. This connects directly to level of ambition tagging where High Ambition goals should sit around 40-50% confidence, not 80%+.
Why Confidence Tracking Changes Everything
Static confidence levels—set once and forgotten—are predictions. Dynamic confidence levels—updated weekly—are early warning systems. The difference is transformational: one tells you what you thought in January, the other tells you what you know in March.
Consider a quarterly business review where three key results missed targets. Untracked confidence offers no insights—“we tried our best” is the default excuse. Tracked confidence tells a story: Result A started at 60%, dropped to 25% by week four (early warning ignored, resources not shifted), Result B started at 70%, stayed at 65% all quarter (execution solid, target was unrealistic), Result C started at 40%, climbed to 55% (learned rapidly, needed one more quarter). Each narrative demands different responses, but only tracked confidence reveals them.
Confidence tracking also calibrates team psychology. When everyone knows confidence is monitored and updated honestly, sandbagging becomes pointless—you can’t hide declining confidence for ten weeks then feign surprise. Conversely, unrealistic optimism gets checked by evidence. The discipline of updating confidence weekly forces teams to confront reality continuously, not just quarterly.
Practical Implementation
Start by scoring all active key results today. Gather teams and ask: “Based on everything we know right now, what’s our honest confidence we’ll achieve this?” Use evidence, not hope: early results, team capacity, technical feasibility, market signals. Score 0-100%, tag in RoadmapOne, and set a weekly update cadence.
Educate teams on confidence calibration using historical data. Pull last quarter’s results and ask: “What confidence level would have been accurate?” Teams discover they’re often overconfident early (predicting 70% success on things that hit 40%) or underconfident late (predicting 50% on things they nail). Calibration improves with practice and feedback.
Set confidence review rituals. Many teams embed confidence updates in weekly standups: “What’s our confidence on Key Result X and why did it move?” The “why” matters more than the number—did new data arrive, did a blocker emerge, did an experiment succeed? Capture the reason, not just the score. This confidence tracking complements validation method tagging —hypothesis-driven experiments typically warrant higher confidence than assumption-based bets.
Generate confidence trend dashboards in RoadmapOne. The visual reveals portfolio health at a glance. Results trending upward show learning and execution; those trending downward signal trouble. Leadership can filter by declining confidence and triage before the quarter burns.
Common Pitfalls and Remedies
The first trap is confidence theatre—updating scores but not acting on them. Teams dutifully mark results at 30% confidence, then do nothing different. This wastes everyone’s time. The fix is leadership response: when confidence drops below 40%, mandate a decision—pivot, double down, or kill. Make confidence actionable or stop tracking it.
The second trap is sandbagging confidence—marking ambitious results at 60% early to avoid scrutiny, then “discovering” they’ll miss late. This poisons trust. The remedy is historical calibration: compare early confidence scores to actual outcomes. Teams whose 70% predictions consistently hit 40% get called out for systemic overconfidence. Data kills deception.
The third trap is treating confidence as blame. If low confidence triggers punishment, teams will lie. Instead, reward honesty: celebrate teams who flag declining confidence early and pivot successfully. When RoadmapOne shows a result dropped from 65% to 30% in week four, and the team reallocated resources to save a different result, that’s strategic agility—praise it.
Board-Level Conversations
Imagine presenting: “This quarter, we started with 12 key results averaging 58% confidence—appropriate for our stretch goal mix. By week six, three had dropped to 25-35% confidence due to technical blockers and market headwinds. We pivoted resources to protect our 75%+ confidence commitments and salvaged partial wins on the struggling results. Final outcome: 100% success on committed goals, 62% average on stretch goals—aligned with our confidence predictions.”
The board debates risk management, not excuses. When you show confidence tracking and explain how it drove mid-quarter decisions, governance shifts from “why did you miss?” to “how well did you respond to emerging risk?” That’s the conversation functional leadership demands.
The Confidence Discipline
Confidence Level % tagging isn’t fortune telling—it’s evidence synthesis. Each score represents team knowledge at a moment in time: what’s working, what’s not, what’s unknown. Update it continuously and confidence becomes a living metric that guides decisions, not a static guess judged in hindsight.
RoadmapOne makes confidence tracking frictionless. Tag 0-25% for long shots, 25-50% for uncertain bets, 50-75% for likely wins, 75-100% for near certainties. Track trends, respond to signals, and watch quarterly surprises become proactive recalibrations.
Your roadmap isn’t a crystal ball—it’s a hypothesis under continuous testing. Tag confidence honestly, update it religiously, and let the data tell you when to stay the course, change direction, or pull the plug. That’s when OKRs stop being aspirational fiction and start being evidence-based strategy.
For more on Key Result Tagging methodologies, see our comprehensive guide .